Islands of Density in a Sea of No-Growth

Source: https://ggwash.org
In “The Great American Single-Family Home Problem,” New York Times reporter Conor Dougherty drives home the point that the high cost of housing in America’s expensive coastal cities can be addressed by densifying the suburban landscape. At first glance this may seem obvious; combatting price appreciation calls for building more homes, and better to do so through infill than by exacerbating sprawl. But the notion of densifying the suburban landscape is a more radical departure from the status quo than it may seem.
In the past, virtually every patch of land in the metropolitan U.S. continually sprouted new housing, but this is no longer the case. In recent decades, residential construction has become increasingly confined to the periphery of American metro areas, while a growing swath of the interior has fallen dormant and produces new homes at a negligible pace. At the same time, a tiny fraction of the land area, scattered in small pockets throughout the metropolitan landscape, is responsible for a growing share of new home production, primarily in large multifamily structures. I refer to this increasingly spiky new pattern of housing production as “pockets of dense construction in a dormant suburban interior.”
The story is best told through maps
The following map colors the residentially developed footprint of the Los Angeles metro area as of 1960 according to the dominant type of new housing built there during the 1940s and ‘50s. It distinguishes between single-family homes in light blue, 2 to 49 unit structures in orange, and 50+ unit structures in red, and assigns each Census tract a color based on the type of housing that accounted for the most new homes during the period.
The map reserves an additional color, dark blue, for areas that produced no new housing at all, or that produced it at a negligible pace, defined as less than 0.1 new homes per acre per decade. This pace is equivalent to less than one new home per acre per century, which means that transitioning a neighborhood from a stereotypical suburban density of 4 homes per acre to a borderline walkable one of 10 homes per acre at this rate would take more than 600 years.
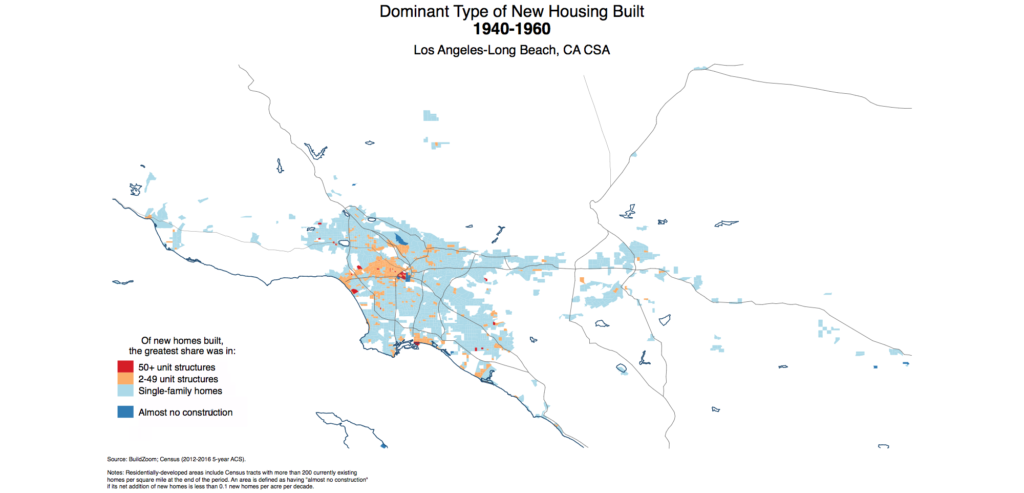
In the 1940s and ‘50s the map was mostly light blue, indicating that the vast majority of the metro area’s developed footprint was producing new housing at a meaningful pace, mostly but not exclusively in the form of single-family homes. Although a number of areas show up in orange, implying a local abundance of moderately sized multifamily structures, only a tiny fraction show up in red, and even fewer show up in dark blue.

By the 1960s and ‘70s, light blue areas still accounted for most of the developed footprint, but they were losing ground. A growing area saw new housing dominated by 2 to 49 unit structures, and the number of red Census tracts in which large multifamily structures accounted for most new homes increased as well. In addition, a scattering of Census tracts begin to show up in dark blue. Some of them – those which appear undeveloped (white) in the previous map – indicate extremely low-density residential development in formerly undeveloped areas, but most of them reflect previously developed suburban areas whose new home production essentially stalled.

The pattern of pockets of dense construction in a dormant suburban interior began to emerge more clearly by the 1980s and ‘90s. Much more of the metropolitan landscape was dormant by this period, showing up in dark blue, while clusters of dense new home construction appearing in red had multiplied. It is visually apparent that the emerging dark blue sea of dormant suburbia expanded mostly into areas that were formerly light blue, though it also ate away at areas that were previously orange. Quantifying the change in the share of land colored orange just by looking at the maps is difficult, but it had actually decreased slightly by this period.
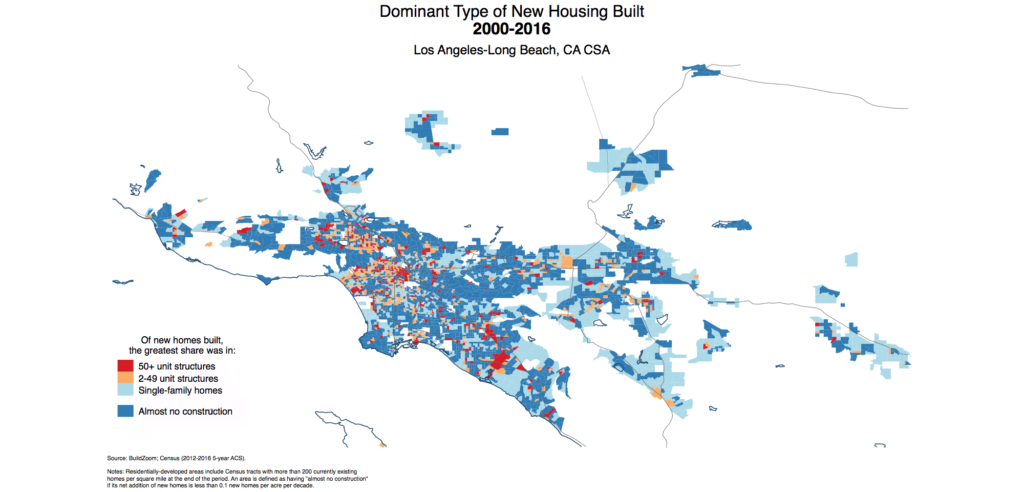
Since the turn of the century, the pattern of pockets of dense construction in a dormant suburban interior has become plain to see. The map consists primarily of dormant, dark blue areas producing new homes at a negligible pace, interrupted by red clusters of dense new residential construction. Areas whose new housing production was dominated by moderately sized structures have shrunk to a mere orange halo surrounding the red dense hubs, whereas the light blue areas dominated by active single-family home construction had receded, and remained present primarily in the current metropolitan periphery in the eastern inland reaches of the metro area – Los Angeles’ so-called “Inland Empire.”
Quantifying things
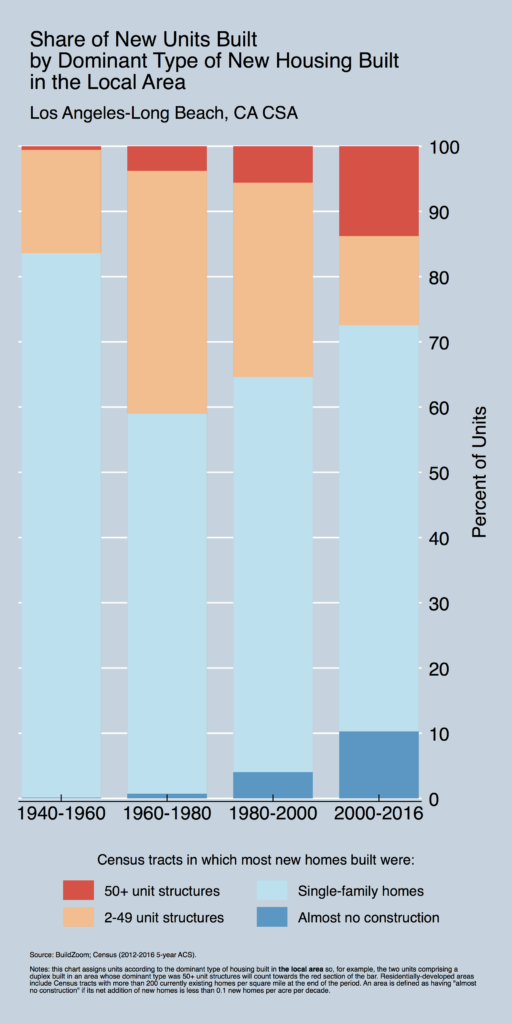
The following pair of charts quantifies the progression over the decades illustrated in the maps.
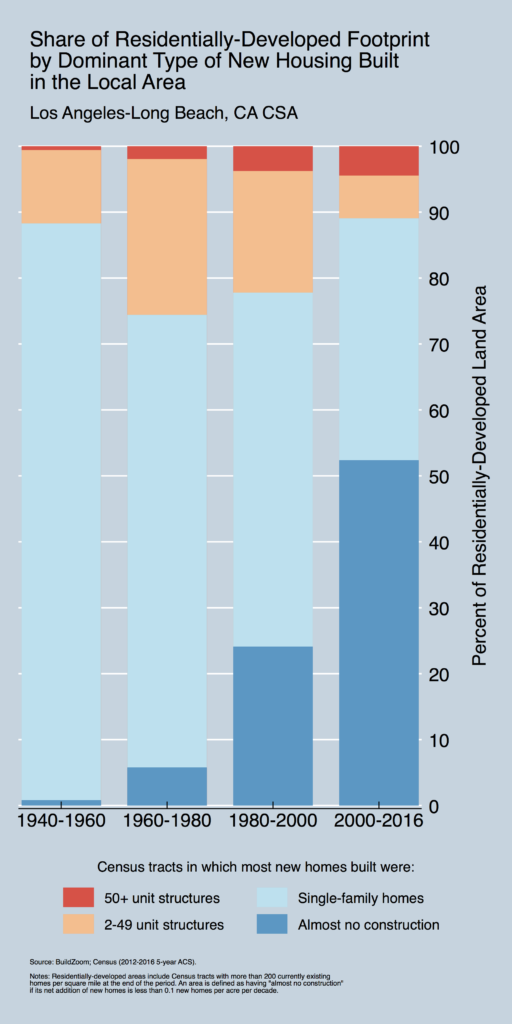
Since the 1940s and ‘50s, when the dormant suburban areas were virtually non-existent, they have swelled to encompass as much as 52.4 percent of the metro area’s residentially-developed footprint, yet despite its vastness it accounts for only 10.3 percent of new homes.
The light blue areas that actively produce new single-family homes and which used to span the lion’s share of the metropolitan landscape now correspond to 36.7 percent of the footprint. These areas are located mostly in the eastern inland reaches of the metro area – the contemporary metropolitan periphery – and they account for almost 62.3 percent of new home production.
The size of the orange areas given to producing homes in moderately-sized multifamily structures has sharply decreased in share, from a peak of 23.7 percent in the 1960s and 70s to just 6.5 percent in recent years.
The pockets of dense construction, almost non-existent in the 1940s and ‘50s, have grown to encompass a modest 4.5 percent of the residentially-developed footprint in recent years. However, because they are densely developed, their modest land share understates the new housing they provide, which amounts to 13.8 percent of the total.
Overall, the numbers indicate that even though the pockets of dense construction stand out among dormant neighboring areas as beacons of new home production, the bulk of new homes built in the metro area increasingly crop up at its periphery, as a result of metropolitan expansion and the ensuing densification of young suburban areas to the point of low-density saturation.
The pattern appears in metro areas throughout the nation
The pattern that has emerged in the Los Angeles metro area is not unique; it is characteristic of metro areas nationwide. The diagram on the left below stylizes the pattern observed in the Los Angeles metro area, while retaining the geographic boundaries imposed by the ocean and the mountains and which channel the bulk of metropolitan expansion to the east.
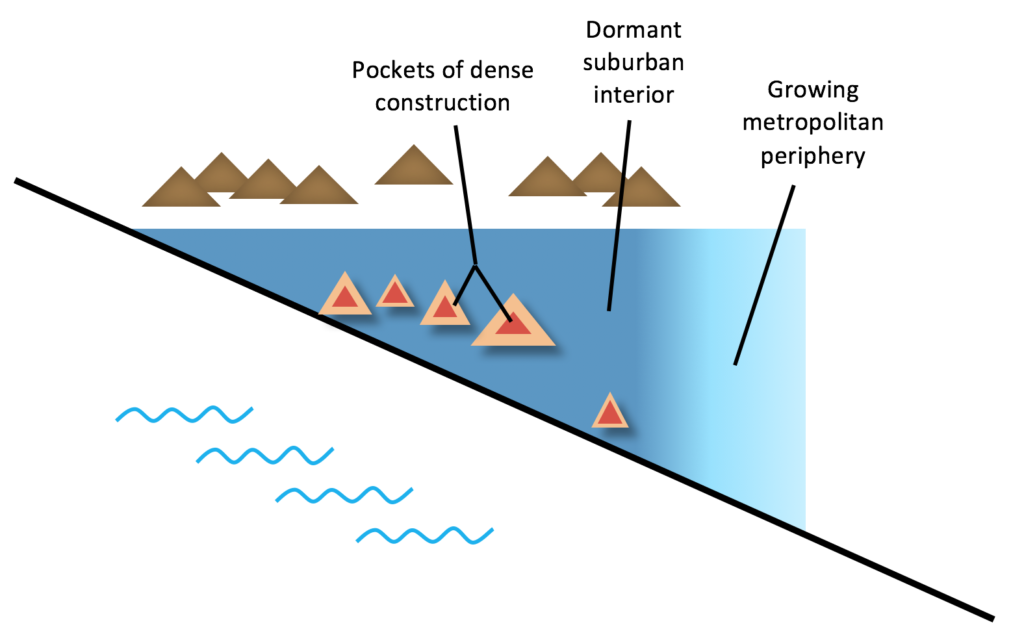

Pockets of dense construction in a dormant suburban interior: stylized diagram of the Los Angeles metropolitan area (left) and abstract diagram of the pattern (right)
The diagram on the right captures abstractly the pattern that has become common to American metro areas in recent decades. In the center is a dark blue dormant suburban sea. It is punctuated by red pockets of dense construction, each with a more moderately dense halo of orange. Surrounding the dormant suburban sea is a light blue metropolitan periphery which continues to produce substantial amounts of new housing.
The collection of animated maps below is ordered alphabetically, and allows browsing through all large U.S. metro areas.
Metros areas such as Atlanta, Dallas, Las Vegas and Phoenix demonstrate the wide metropolitan periphery that characterizes the growing, affordable cities of the U.S. South – which I have elsewhere called Expansive Cities – in which large amounts of new housing emerge in new subdivisions.
In contrast, metro areas like Cleveland and Buffalo demonstrate the narrow metropolitan peripheries characteristic of Legacy Cities, whose tepid demand for housing is more than met by the existing housing stock, causing real estate values to plummet and inhibiting growth.
The San Francisco Bay Area, which has gradually slowed down its outward expansion to a crawl, demonstrates a relative absence of an expanding metropolitan periphery. Other expensive coastal cities, such as the Boston, New York, Seattle and Washington show a variety of patterns vis-a-vis their metropolitan periphery, but none have one as wide as the growing, affordable cities of the U.S. South, and all of them exhibit the pattern of pockets of dense construction in a dormant suburban interior.
A subsequent article available here provides interactive versions of these maps, in which housing built in each period can be transparently layered on.


Download maps and charts for all large U.S. metropolitan areas (158.2MB)Download Excel table of bar chart statistics for all large U.S. metropolitan areas (39.7KB)
Making sense of the pattern: low-density saturation
Most of the metropolitan land area in the U.S. consists of low-density suburban fabric whose housing density is effectively capped by local land use policy. When such fabric is young it can usually accommodate more housing through infill, first with entire new subdivisions filling in gaps in sprawl, and later with development of smaller vacant lots. Such infill comes at the cost of open space, but it tends to fall in line with the rules maintaining the low-density character of the area. As long as accommodating more homes relies on devoting more land to housing rather than using previously developed residential land more intensively, it can occur within the framework of current density-prohibiting land use policy without drawing fire.
Thus, without allowing previously developed residential land to be redeveloped more densely, the capacity of suburban areas to accommodate more housing is bounded by their ability to devote additional lots to housing. Once suburban fabric matures, in the sense that the land cover is saturated with development, then the production of new homes usually grinds to a halt.[1] Pockets of dense construction are the exception – places in which dense housing projects are not unthinkable. They tend to arise in several contexts:
When density is grandfathered into the character of an area by existing development, as it tends to be in historic downtowns.
When housing is introduced into a non-residential area, because such areas lack the bucolic, low-density residential character that elicits activist protection in the first place.
When the case for densification is sufficiently compelling to overcome opposition, as it sometimes is near transit hubs and corridors.
When the demand for housing is strong in low-income suburban areas, as it often is in gentrifying ones, where residents are not as well-equipped to resist densification as those of more affluent communities.
It has not always been the case that local land use policy prohibited most of the metropolitan landscape from densifying. Before World War II, organic densification through gradual redevelopment was commonplace. Moreover, judging by the peak share of land dominated by the development of 2-49 and 50+ unit structures in metropolitan Los Angeles – which shows up in most other large U.S. metros as well – the 1960s appear to have been a time of greater densification relative to the ’50s and to the decades that followed.[2] The modest wave of densification in the 1960s appears to have been stymied as the blanket of density-prohibiting land use policy became more comprehensive.
In general, more local control over development is detrimental to densification. The opponents of development tend to be concentrated locally, while those who stand to benefit from it tend to be widely dispersed and unaware. The construction of new apartment building, for example, may draw fire from neighbors while benefiting its potential residents as well as the multitudes who stands to gain from its incremental dampening effect on rents. The beneficiaries are generally non-local, yet local control implies that only local residents have a say, resulting in less development than would obtain if everyone affected by it had a say. This state of affairs, in conjunction with the political fragmentation of individual metropolitan landscapes into numerous cities and suburbs, has allowed the density-prohibiting land use policy to develop. The role of community participation in the planning process – which is often mandated – further empowers existing residents at the expense of the broader affected public.
Political fragmentation and the proliferation of local land use policy also mean that powering through the infill development process now depends more heavily than before on local expertise and relationships. Infill development has essentially become a different line of business than greenfield development, and one which often deters potential developers who are not locally entrenched. In addition, as the number of commercial banks in the U.S. has dwindled – most of them local – the traditional system of local bank-financed construction loans has lost ground to one based on non-local institutions, including private equity firms. The non-local nature of these funding sources makes it likelier for investments to be doled out with limited enthusiasm for performing due diligence on small, local projects. As a result, it is becoming increasingly difficult to obtain funding for small-scale infill development. Rather, funding is increasingly available only in sizable chunks that translate into large new greenfield developments or large multifamily projects. The latter are reflected in the proliferation of 50+ unit structures, at the expense of smaller ones, which are increasingly challenging to finance.
Pockets of dense construction, or modest densification everywhere?
City planners tend to favor concentrating residential development in dense hubs because they lend themselves to service by public transit, which helps reduce the impact of new residents on emissions and traffic congestion. Yet this rationale for limiting densification to transit hubs and corridors amounts to acquiescing the battle for development elsewhere. The current battleground is in the pockets of dense construction, whereas the dormant suburban interior is conceded territory in which dense housing is never debated because it is never proposed. It is taboo.
Confining development to dense hubs is a sensible approach, but it has come at a great cost. Over recent decades, America’s expensive coastal cities have slowed down their outward expansion and increasingly come to rely on residential densification within the developed footprint to accommodate the people drawn to them. Yet rather than pick up its pace, densification has become less common. As a result, residential construction in the expensive coastal cities has failed to meet demand and prevent runaway housing price appreciation, resulting in an affordability crisis with profound implications for younger generations’ ability to put down roots, live near family, raise children and prosper.
This doesn’t mean that the expensive coastal cities can’t deliver much greater amounts of housing. They can. But to meaningfully stem housing price appreciation would require them to regularly produce far more housing than they have for decades. The track record of the current paradigm – minimize metropolitan expansion and concentrate new housing in dense hubs – suggests they will keep under-producing housing in the future as well.
I am not advocating a return to vigorous sprawl. That would be wasteful, unhealthy and unsustainable. Moreover, the rising value of central locations in the eyes of both people and employers suggests that sprawl may offer a less appealing substitute to housing in the metropolitan interior than in the past, especially in the largest metros.
I am suggesting that, while cities continue to fight the battle for development in dense hubs, they also question the de facto exemption granted to low-density suburban areas from the onus to produce more housing. The dormant suburban sea is so vast that if the taboo on densification there were broken, even modest gradual redevelopment – tearing down one single-family home at a time and replacing it with a duplex or a small apartment building – could grow the housing stock immensely. Distributing the necessary amounts of new housing over vast low-density suburban areas instead of just concentrating them in dense hubs would dilute the local impact on neighborhoods. It would make a large increase in housing more palatable vis-a-vis neighborhood character, and more gradual. Of course, building in these areas could have different implications for congestion than building in dense hubs, but the affordability crisis in America’s expensive coastal cities is so acute that the tradeoff between worsening affordability and congestion should be evaluated with fresh eyes.
In order to nurture new residential development in the dormant suburban interior, local land use policy would need to undergo a revolution. The construction industry and the financial ecosystem would need to evolve as well, and infrastructure would need to be greatly upgraded. The very first step, however, involves grasping America’s new metropolitan landscape and realizing just how much of it has gone dormant. That is where the problem is, as well as the opportunity.
Notes
An important exception to the rule is the repurposing of land used for non-residential uses to support housing. Another exception is the process of subdividing larger units into smaller ones, which raises the number of homes without altering the square footage of existing structures. Yet another exception is the construction of separate-structure accessory dwelling units, also known as in-law units or granny flats, which amounts to a form of micro-infill.
The bar charts above show that the land share dominated by 2-49 and 50+ unit structures peaked from 1960 to 1980. However, outward metropolitan expansion was substantially more vigorous in the 1970s than in the 1960s, both nationally and in the Los Angeles metro area, suggesting that the land share given to these dense categories of new construction actually peaked in the 1960s.
Data and methodology:
The study uses Census tract-level data on the number of housing units, broken down by units in structure and year built (Table B25127), obtained from the 2012-2016 5-year American Community Survey (ACS) compilation. Census tract land areas used for calculating densities were obtained from 2015 Census TIGER/Line shapefiles.
Census tracts were considered to be residentially-developed at the end of a period if their housing density exceeded 200 currently existing homes as of the end of the period. For example, a Census tract was considered residentially-developed in the 1940 to 1960 period if the number of housing units built prior to 1960 and observed in the 2012-2016 5-year ACS implied more than 200 such housing units per square mile. This is a rough method for gauging when an area was first developed. For additional details, see methodology sections here and here.
Census tracts were assigned a dominant type of new housing among the following categories depending on which category accounted for the most new homes built during the period: (i) single-family homes (detached and attached), (ii) 2 to 49 unit structures, and (iii) 50+ unit structures. The assignment relies on using currently-observed homes as a proxy for those actually built during the period.
Census tracts in which the number of new homes built during a period increased the tract-level housing density by less than 0.1 homes per acre per decade – equivalent to 1 new home per acre per century – were reassigned as having “almost no construction.” Because the 2012-2016 5-year ACS compilation contains observations from all five years’ ACS surveys, obtaining comparable figures for the 2000 to 2016 period does not amount to simply dividing the total per acre figure by 16. Rather, because the average time in which each ACS observation was taken is mid-2014, the per acre figures were divided by 14.5 years observed since 2000 (including 2000).